
The Road to 10 Billion Tokens
We hit 10 billion tokens.
Well, not yet. But getting there is not really a question of how quickly we can send more text through a model. Anyone can manufacture token volume. For smashDATA, 10 billion would only matter if it were earned through repeated, useful work: operators asking real questions of their business data, following the answers deeper, challenging assumptions, finding problems, and making better decisions while those decisions can still matter.
That is what makes the number interesting. Ten billion tokens would be a lagging indicator that conversational analytics had moved beyond a clever demo and become part of how businesses operate. The trophy would not be the achievement. It would be evidence that smashDATA had become useful enough for people to trust it with the next question, then return tomorrow with another.
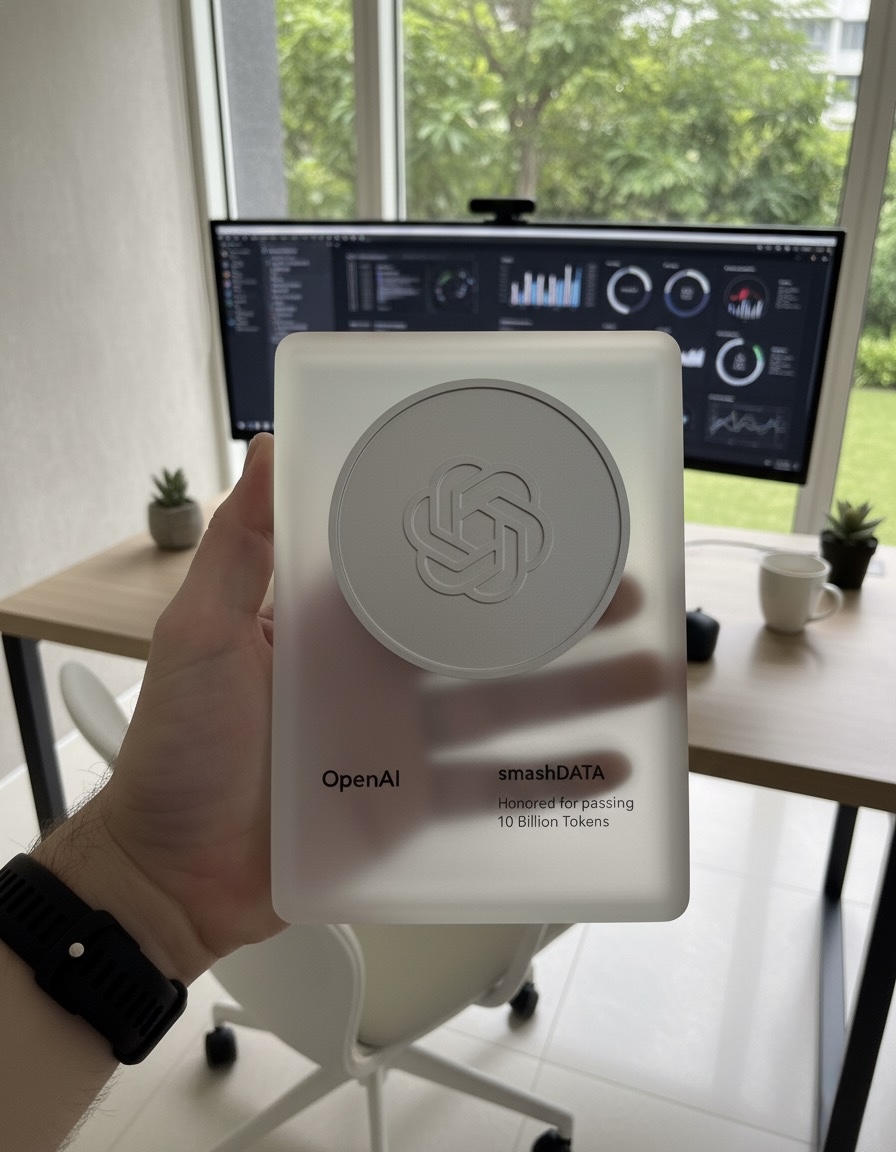
Ever since OpenAI’s developer day back in October, I have seen a steady stream of teams posting pictures with their token trophies and celebrating what they built. It fueled my curiosity and raised a question I have not been able to shake:
What would need to be true for smashDATA to earn its own 10 billion token award?
Working backwards
So that is what we did. We imagined the future announcement, worked backwards from it, and distilled the path down to three ideas:
- If operators were really winning, they would have more answers than dashboards.
- If outcomes are the goal, time-to-impact is the only scoreboard that counts.
- If smashDATA is truly a market leader, the complexity of business data must become invisible to the person asking the question.
Those ideas sound simple. Each one has significant implications for how an analytics platform must be designed.
More answers than dashboards
Dashboards are useful, but they are also constrained by the questions someone anticipated when building them.
Every chart begins with a series of decisions:
- Which metric should be displayed?
- Which dimensions should be available?
- Which time period should be selected?
- Which filters will people need?
- Which relationships between systems should be modeled?
- Which follow-up questions are likely enough to deserve their own view?
The result is a predefined window into the business.
That works until the next question falls outside the window.
An operator sees revenue decline and wants to know why. The dashboard may show the decline, but the explanation could require several additional steps:
- Break the change down by channel.
- Compare new and returning customers.
- Separate traffic changes from conversion changes.
- Examine product availability.
- Identify whether the shift began before or after a campaign.
- Compare the result with the same period last year.
Traditional analytics turns that investigation into a scavenger hunt across dashboards, filters, exports, and requests to an analyst.
Conversation changes the interaction.
The first answer becomes the beginning of the analysis rather than the end of a report. The operator can ask a question, inspect the evidence, challenge the result, narrow the scope, and continue until the pattern makes sense.
That is why we made smashDATA conversational and integrated it into tools people already know how to use.
The goal is not to replace every dashboard with a chat box. The goal is to remove the artificial boundary between seeing a result and investigating it.
A dashboard tells you what someone prepared.
A conversation lets you ask what matters now.

Time-to-impact is the scoreboard
Analytics platforms are often evaluated by the size of their feature lists, the sophistication of their architecture, or the number of data sources they support.
Those things matter, but they are not the outcome.
The outcome begins when someone connects business data and receives an insight useful enough to influence what they do next.
That is why we focus on initial connection to useful insight as an early measure of success.
There is a meaningful difference between connecting a source and making its data usable.
A technical connection may prove that credentials work and records can move. A useful connection must also establish enough business context to answer questions correctly:
- What represents a customer?
- Which field contains recognized revenue?
- How are campaigns associated with orders?
- Which timestamp should be used for a particular metric?
- How should refunds, cancellations, or duplicate records be handled?
- Which systems describe the same business entity differently?
The distance between data connected and question answered is where many analytics projects slow down.
The usual response is to add more implementation work. Build another pipeline. Create another model. Define another dashboard. Schedule another review.
We are working toward a different experience: shorten the path from connection to understanding.
That does not mean pretending the underlying work disappears. It means designing the product so users do not have to personally coordinate every technical step before they can ask a useful question.
If an operator can connect sales, marketing, and ecommerce data and begin investigating the business while the question is still relevant, the platform has created value.
If it takes months to reach that point, the architecture may be impressive, but the impact is late.

Complexity should disappear behind the question
Business data is messy because businesses are messy.
Systems were purchased at different times for different purposes. Each one carries its own schema, authentication model, terminology, update cycle, and assumptions.
One platform calls it an account. Another calls it a customer. A marketing system sees a lead. An ecommerce system sees an order. A finance system sees a transaction.
The operator does not want to reason about those boundaries. They want to ask:
- Which campaigns produced profitable customers?
- Why did conversion change last week?
- Which products are gaining momentum?
- Are repeat customers behaving differently?
- What should we pay attention to next?
Today, the user often becomes the integration layer. They move between systems, reconcile conflicting definitions, export files, align dates, and assemble enough context to answer one question.
That is the complexity smashDATA is designed to absorb.
Our integration-as-a-service approach moves the hard parts behind the scenes so the platform can behave like one coherent source of business context.
Underneath a simple question are problems involving:
- Authentication
- Source APIs
- Schema differences
- Data normalization
- Entity relationships
- Metric definitions
- Data freshness
- Pagination and rate limits
- Source-specific failures
- Changes to upstream systems
Those problems do not stop existing. They stop being the operator’s job.
That distinction matters.
The best infrastructure is not infrastructure the user constantly notices. It is infrastructure that makes a more natural interaction possible.

Tokens as evidence, not the objective
There is an important tension in setting a goal around token usage: a good AI product should not consume more tokens than necessary.
If the same accurate result can be produced with fewer tokens, less latency, and lower cost, that is a better system.
So we are not trying to maximize token consumption for its own sake.
We are trying to create enough repeated utility that meaningful usage compounds naturally.
Ten billion tokens should represent:
- More operators asking questions directly
- More business context available to support those questions
- More follow-up analysis without a new dashboard request
- More teams sharing a common understanding of their data
- More useful answers delivered while decisions can still be influenced
- More people participating in analysis without becoming analytics engineers
The number matters only if the activity underneath it matters.
I would rather reach 10 billion tokens through millions of useful questions than reach it quickly through inefficient prompts and synthetic workloads.
One is adoption. The other is consumption.
What we will measure along the way
The trophy is a distant lagging indicator. The signals that matter now are much closer to the user.
We care about questions such as:
- How quickly can a company move from its first connection to its first useful insight?
- Do operators return with new questions?
- Can they continue an investigation without leaving the conversation?
- Are answers grounded in the right business context?
- Does the platform reduce the need to manually reconcile systems?
- Can someone reach an answer without waiting for a new report or dashboard?
- Does the insight change a decision, priority, or action?
These measures are less visible than a token counter, but they tell us whether the product is becoming part of how a business operates.
Repeated usage should be earned by repeated usefulness.
Everyone can be a data person
When we say we are working toward a future where everyone can be a data person, we do not mean everyone needs to become an analyst.
They should not need to learn SQL, understand a warehouse schema, build semantic models, or memorize which system owns each metric.
Being a data person should mean being able to ask a precise question, examine the evidence, follow the result, and make a better decision.
That is a much larger population than the group currently building dashboards.
It includes the founder trying to understand growth, the marketer investigating campaign performance, the sales leader reviewing pipeline quality, and the operator trying to determine what changed overnight.
The common requirement is not a dashboard.
It is access to trusted business context at the moment a question becomes important.
Earning the announcement
Someday, I hope we get to publish the real version of this post.
By then, the interesting part will not be the trophy or the number engraved on it. It will be the accumulation of all the questions that brought us there.
Questions that once required exports.
Questions that once waited in an analyst backlog.
Questions that crossed multiple systems.
Questions that led to better decisions.
We will announce 10 billion when it is earned.
Until then, we will keep reducing the distance between connected data and useful insight, hiding the complexity that should never have belonged to the operator, and shipping the capabilities our clients need to ask better questions.
The goal is not to generate more tokens.
The goal is to make business data useful enough that 10 billion tokens become inevitable.